
Riding the XB Plane
Assignment 3
By Amber Candela
___________________________________________________________________________________________________________________________________
Let's take a different look at quadratics
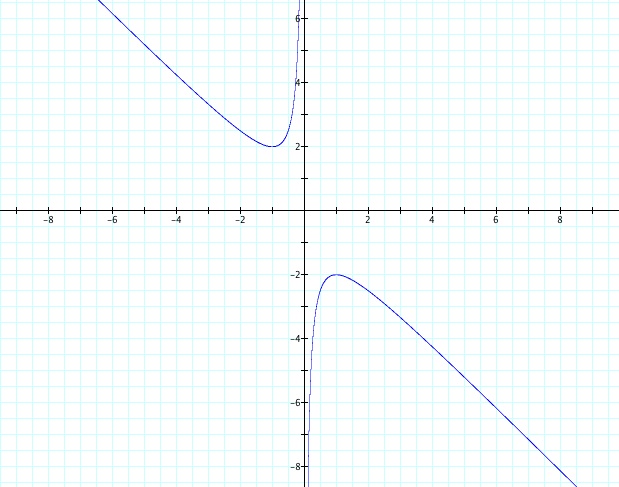
Take the quadratic equation below and graph. Notice that the "b" value has been replaced by "y".
![]()

In order to be able to find the roots of the equation, you must graph y = a for particular values for "a". The intersection of these two equations gives the roots for when y = a. If y = 3, there will be two positive real roots.

All about the roots
How can the roots of the equation be found? Look at the branches of the graph, when b > 2, there will be two real roots and they will be negative. When b < -2 there will be two real roots and they will be negative.When b = 2 there will be one negative root and when b = -2 there will be one real positive root. When -2 < b < 2 there will be no real roots of the graph.
Let's change the value of "c"
If the value of "c" is changed, the whole graph will change. Replace "c" with -1 to get the following equation and graph.
![]()

What changes?
When c = -1 there is a new graph created. There will now always be two real roots for any value of "b", one will be negative and one will be positive. When b = 0 the roots are -1 and 1.
Can we generalize?
When looking at different values of "c" it was found that if c > 0 then the roots depend on the value of b. The discriminant of the quadratic equation, b2- 4ac will determine the number of roots and whether or not the root will be positive or negative. There are three different cases for the discriminant, it can be equal to zero, greater than zero or less than zero.
Below is the animation of case 1. This shows when there is the root that is tangent to the graph. The graph shows both tangent line, but they are for different values of b.
Below is the animation for Case 2 and Case 3. The yellow shows Case 2 and the blue shows Case 3.
And the generalizations continue.....
What if c < 0? If c < 0 there will always be two roots, one will be negative and the other will be positive. Below is the animation when c > 0. There are two lines because there is the positive and negative value of b. The two lines represent two separate values for b.
Your Turn
These are graphs in the xb plane because the value of b was replaced with y. Now try different values in the xa plane or the xc plane!